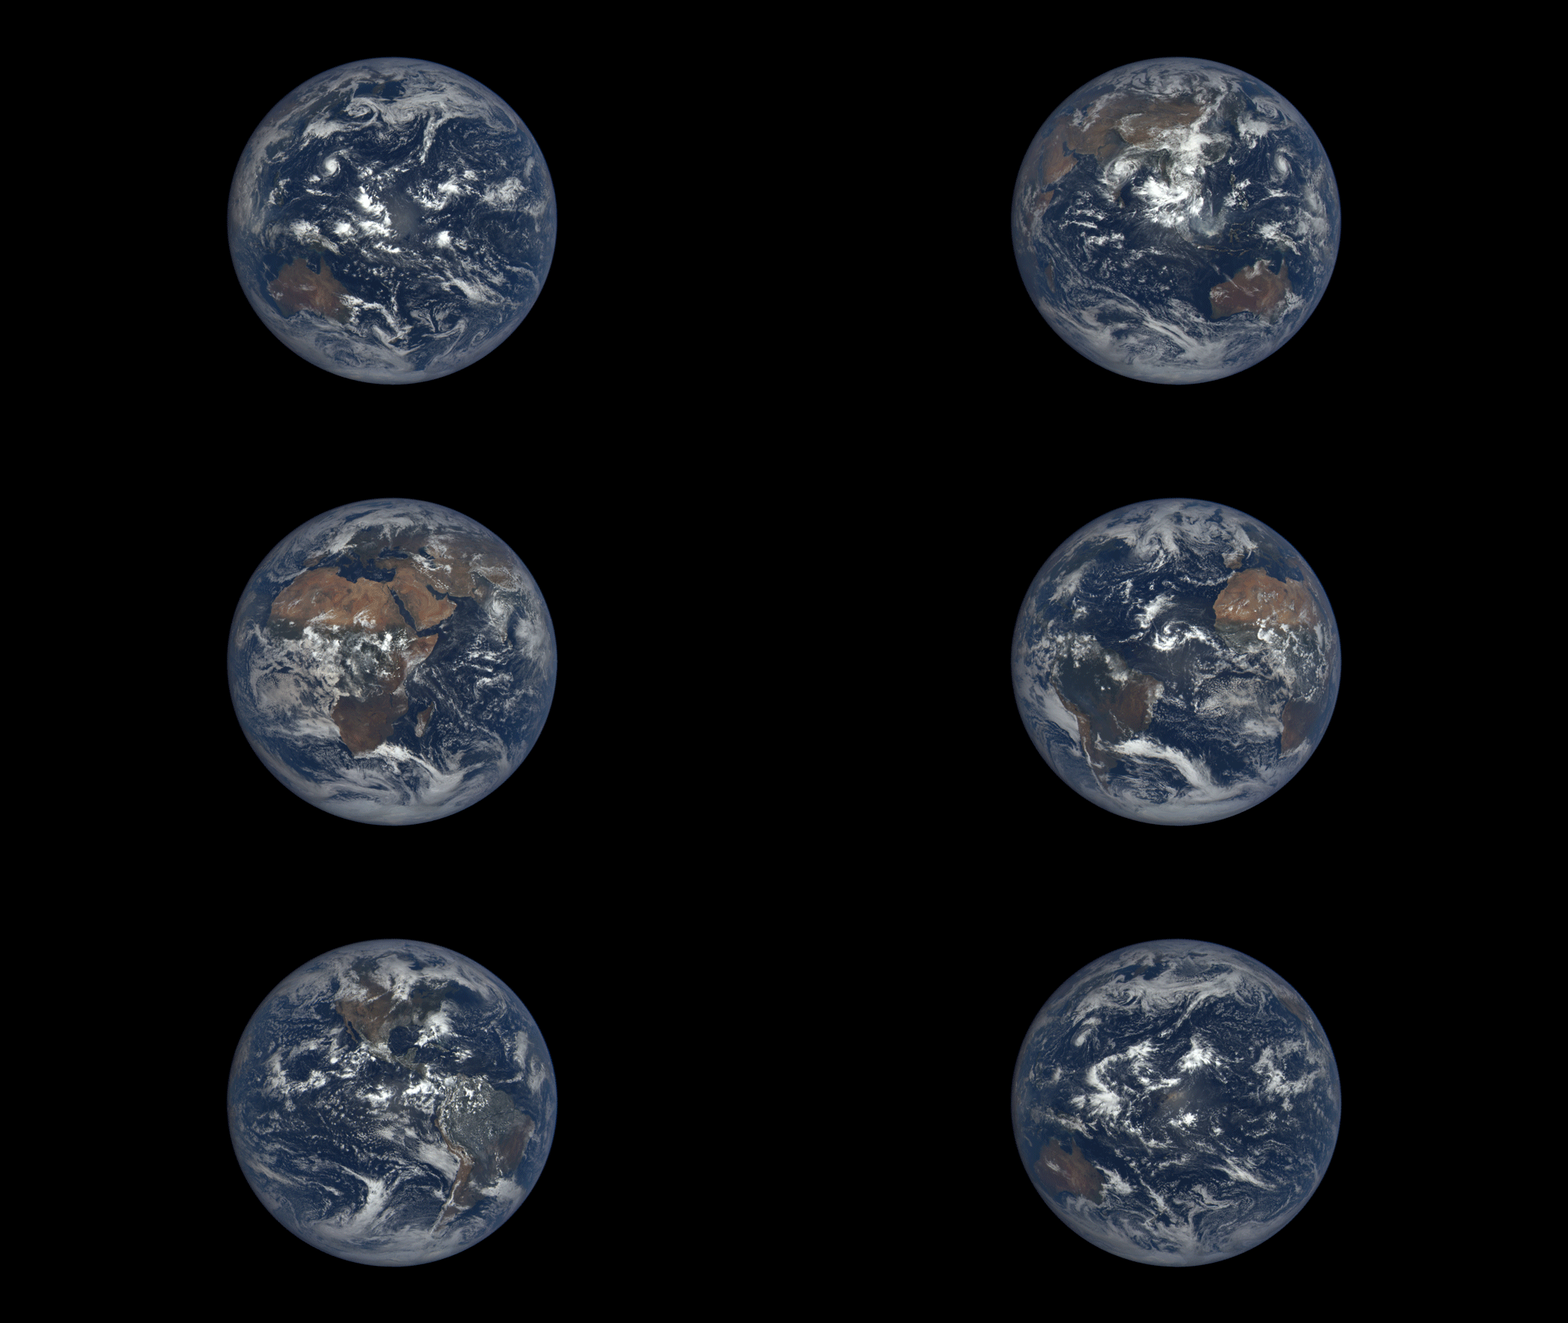
20 Years of Earth Environmental Changes Captured in just a few seconds
Incredible visualization by NASA shows the catastrophic effect that climate change has had on our planet over the past two decades. The latest NASA visualization shows 20 years of non-stop examination of plant life on land and at ocean’s surface, from 1997 to 2017. This conceptualization was created with the data from satellites including SeaWiFS (Sea-Viewing Wide Field-of-View Sensor), Visible Infrared Imaging Radiometer Suite (VIIRS) and Moderate Resolution Imaging Spectroradiometer (MODIS).
Many satellites were used from 1997 to this year, for the compilation of the data. Polar ice caps and snow cover are expanding and shrinking with the alternating seasons. Also, the varying shades of blue, green, red and purple in the oceans depict the abundance or lack of undersea life.
“It’s like watching the Earth breathe. It’s really remarkable,” said NASA oceanographer Jeremy Werdell.
By showing this clip, NASA stressed on how spring is coming earlier and autumn is lasting longer in the Northern Hemisphere, and how polar ice caps in the Arctic and Antarctic ocean have been receding rapidly over time.
Mr Werdell continued: “It’s like all of my senses are being transported into space, and then you can compress time and rewind it, and just continually watch this kind of visualization.”
This video shows the Arctic ice caps receding over time and the noticeable, but less obvious, melting of the Antarctic ice and the Earth’s fluctuations brought about by changing seasons over the past two decades.
“That is the Earth, that is it breathing every single day,” said oceanographer Gene Carl Feldman, “Changing with the seasons, responding to the sun, to the changing winds, ocean currents and temperatures.”
This data set is powerful because it tells us what’s happening now, what happened in the past, but also what’s going to happen in the future.


